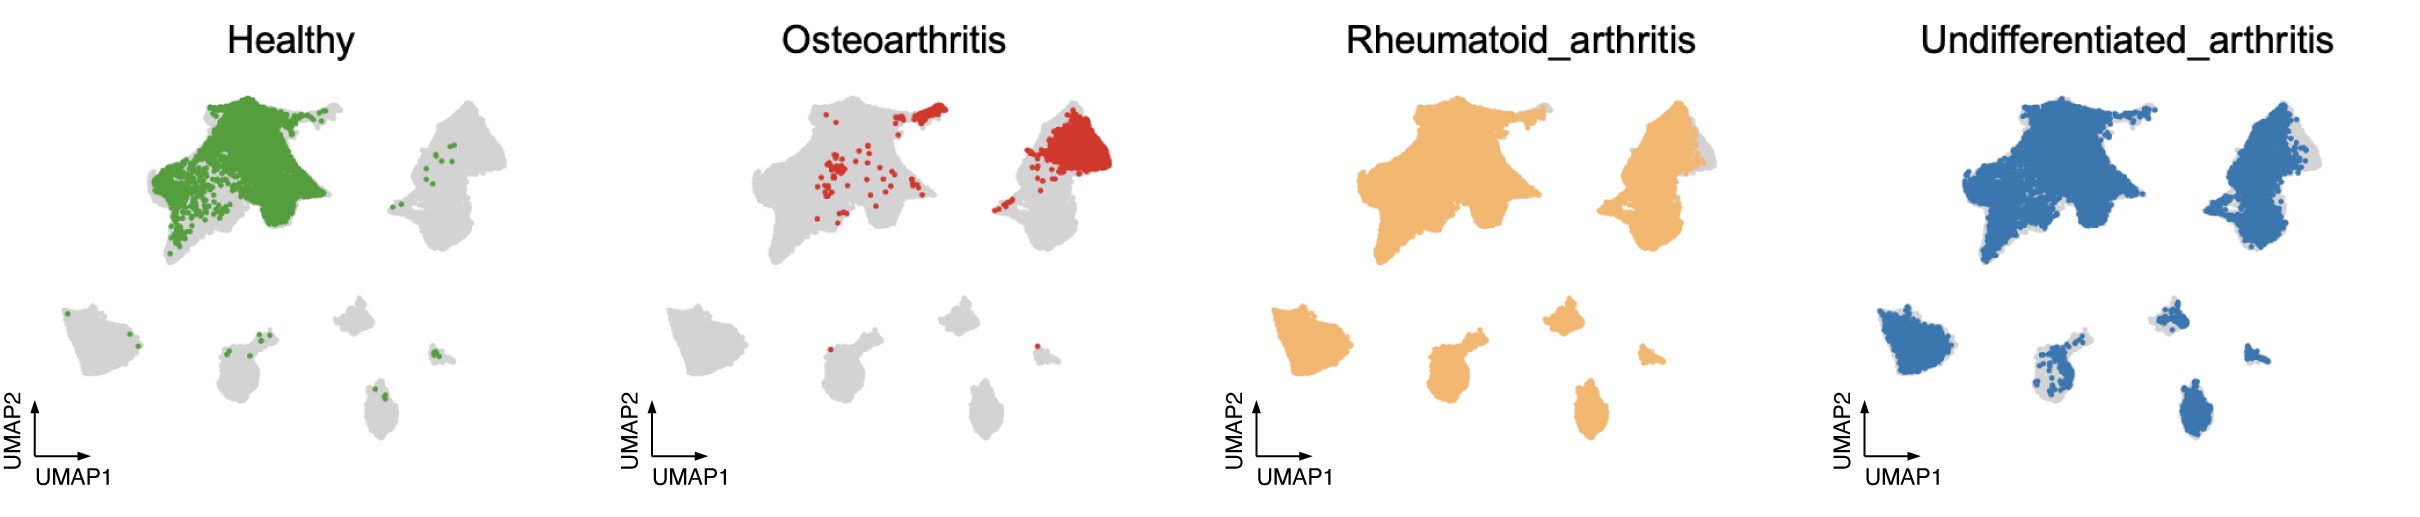
Atlas information

Integration of single-cell RNA seq from 3 studies, including 3 disease types and healthy individuals.

Gene name


Group key for gene expression violin plot

Cell color options

Render Options

Number of displayed cells

You may subset the whole dataset (10000 cells recommended) for better plot interaction

Scatter size

You may want to adjust the point size of the plot


UMAP by disease
UMAP by celltype
Expression of in different groups
UMAP by gene expression
UMAP split by disease